
By Johan Snels – Data Engineer
Welcome to another episode in our blog series around data platforms. In my previous blog, I talked about reasons why you might need a data platform. Short summary: you need one. This time, we’ll tackle one of the most-asked questions nowadays: which reporting tool should I pick? At the end of this blog, you’ll have a better idea of the option which suits you best. I’ll already give you the answer here and it’s one of the worst possible answers ever: it depends! Let me guide you through our line of thought.
Abstract
I’m a data engineer who has lost all connection to the academic world. I have not published a single paper in my life, except for my master’s thesis, which was – I have to admit – of questionable quality and it did not even get published if I come to think about it. However, I understand that it’s good practice to reveal the most interesting part of one’s analysis up front. Please continue reading though, as I’m getting paid per line that’s being read here.
My main conclusion: the market dominance of Tableau is heavily challenged by Power BI nowadays. Certainly in Belgium, Power BI is enormously popular and has become the go-to reporting tool. Let’s see where this comes from.
Side note: I realize that I’ve ignored quite a few alternatives in this exercise. The most obvious examples are Qlik, Looker, Grafana and Google Data Studio. However, in our experience, these are either very comparable to Tableau (i.e. Qlik) or are not as mature as Power BI or Amazon QuickSight (yet). At least in Belgium, we feel that most demand is centered around Power BI.
Tableau – still the pick in certain cases
Founded in 2003, Tableau has established itself as a leading choice for data analytics in many organizations. With a large and active community, it is widely regarded as one of the most mature and stable BI platforms available today. Additionally, Tableau offers an extensive range of data visualizations and the flexibility of being cloud-agnostic, making it a versatile option for businesses.
Since its acquisition by Salesforce in 2019, Tableau has continued to evolve. While the platform remains largely independent, companies that are already leveraging Salesforce may benefit from deeper integrations in the future, particularly in areas such as marketing analytics, where Salesforce has a strong presence.
However, the BI landscape is becoming increasingly competitive, with other platforms experiencing rapid growth. Several factors contribute to why organizations might consider alternatives such as Power BI or Amazon QuickSight.
One key consideration is pricing. Tableau’s cost, at approximately $70 per user per month for a Creator license, is higher compared to alternatives like Power BI and QuickSight, which offer similar roles at a more budget-friendly price point of around $10 per user per month. For small and medium-sized enterprises (SMEs), affordability often plays a crucial role in the decision-making process.
Another factor is usability. While Tableau is a powerful tool, it has a steeper learning curve compared to its competitors. Power BI, for instance, leverages familiarity with Excel, making it easier for users to adopt, while Amazon QuickSight focuses heavily on intuitive user experiences.
Additionally, the growing adoption of cloud-based data platforms from AWS and Microsoft has led many companies to seek BI tools that align seamlessly with their existing cloud ecosystems, offering a more integrated approach to data analytics.
In conclusion, Tableau remains a solid choice for organizations that prioritize a well-established, feature-rich BI solution and are willing to invest in its capabilities. For others, particularly those seeking cost efficiency and ease of use, alternative platforms may present a more attractive fit.
Power BI vs Amazon QuickSight
Let’s have a look at the rising stars in the world of reporting tools, Power BI and Amazon QuickSight. There are great similarities between the two offerings. They actually score very similar in terms of pricing, learning curve and connectivity with other applications.
The most important advantage of Power BI is that it integrates seamlessly in the Microsoft ecosystem. The main pillar of Microsoft’s market strategy is their ecosystem and it starts paying off. Belgium is a country where a large share of companies works with Microsoft Office, SharePoint, Teams and the Dynamics suite. Once attached to these applications, the next move is to choose Azure as your preferred cloud provider, which in turn encourages companies to opt for Power BI. It feels very Excel-like, has a large variety of connectors and integrates with Windows Active Directory Authentication.
However, not everybody is a Microsoft fanboy as myself. Most of these “other” people prefer Amazon Web Services as their go-to cloud provider, at least in Belgium. Needless to say that these companies tend to prefer Amazon QuickSight as their reporting tool. QuickSight has a remarkably low learning curve because of its attention to user friendliness. A nice feature is Autograph, which automatically selects the most appropriate graph for visualizing your data, based on the type of data you want to portray on your screen. Some say that the fast pace of new features in QuickSight causes it to be less stable, but we’ve not experienced that ourselves at Infofarm. So as far as we’re concerned, that should not be a reason to refrain from using Amazon QuickSight.

The figure above gives an overview of the most important features and helps to compare between the two offerings. As mentioned before, they are very comparable apart from a few differences. The most important one is that Power BI is more complete and customizable. Amazon QuickSight doesn’t offer candlestick graphs, Gantt charts and high & low close charts for example. Important for some, but negligible for most. In some cases, Amazon is more attractively priced though, but I’ll leave that as a cliffhanger for my next paragraph.
Pricing
Since pricing remains one of the most important criteria in the choice of a reporting tool, I’ve added a small paragraph to provide more insight. Note that this exercise is based on pricing information available at the beginning of 2023.
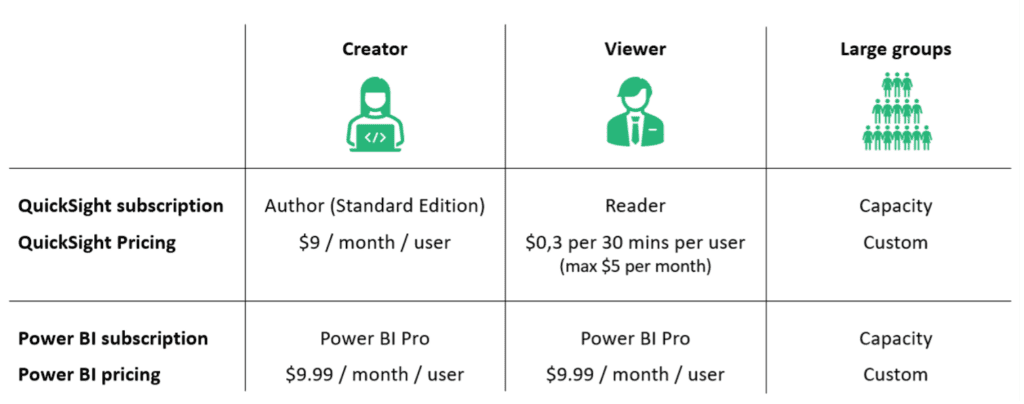
For each person who designs, creates and shares reports within your organization, you need a Power BI Pro license ($9.99 per user per month) or an Amazon Author license ($9 per user per month). As from a certain number of users (around 500, depending on the situation), capacity plans are available for both providers. I’m not going to take this scenario into consideration for the sake of simplicity.
Next to report creators, you also have people who are only viewing these reports, but are not contributing to any content. Let’s call these people viewers. They mostly come from the evil side, called “Business”. The most important difference in pricing comes from the fact that Amazon QuickSight offers a pay-per-use pricing for report viewers. This means that you are charged $0.3 per session of 30 minutes, with a maximum of $5 per user per month. Microsoft doesn’t offer pay-per-use pricing for report viewers (as of yet). This means that viewers in Power BI also need a Pro license, which comes at $9.99 per month. Consequently, you pay at least $5 per viewer per month extra for Power BI as compared to QuickSight.
Long story short: If you have a large number of viewers, but a small number of report creators, Amazon QuickSight offers the most attractive pricing. In most other cases, the differences are quite small.
I have to say that the exercise above is very high-level. If you want to have a detailed estimate for your situation, just let me know. We offer a free session where we go through the different pricing models with you.
Conclusion
The choice between Power BI and QuickSight really boils down to preference. In general, Power BI scores a bit better on overall features and connectivity, while Amazon Quicksight is often the most interesting in terms of pricing. Power BI fits more into architectures built around the Microsoft ecosystem (such as Azure), while companies that have their cloud operations running in Amazon will most likely find it easier to use Amazon QuickSight. To wrap things up, below are some of our recommendations for specific scenarios.
Do you have (or need) Office 365 licenses?
Power BI Pro is included in your license, so this is your obvious choice.
Do you use AWS as your main cloud provider?
Use Amazon Quicksight
Do you use Azure as your main cloud provider?
Use Power BI
Are you currently moving to the cloud and choosing between AWS or Azure?
This is a larger exercise where the cost of the whole data platform needs to be taken into account. Nevertheless, all things equal, Amazon Quicksight will probably be most interesting from a pricing point of view.
References
To really wrap things up, I’ve also included some interesting links below. If you don’t believe what I’m saying about Amazon QuickSight pricing, you can check for yourself at the Amazon QuickSight Pricing Calculator.
As far as I know, you don’t have a pricing calculator for Power BI specifically. They do, however, provide a website that doesn’t calculate anything, but simply lists the prices for their different subscriptions here.
Finally, Microsoft has bundled some information on its Power BI subscriptions and how people with different subscriptions can collaborate in your organization. You can find this information right here.
If you’re excited about our content, make sure to follow the InfoFarm company page on LinkedIn and stay informed about the next blog in this series. Interested in how a data platform would look like for your organization? Book a meeting with one of our data architects and we’ll tell you all about it!
Want to start building your own data platform straight away? Take a look at the InfoFarm One Day Data Platform. A reference architecture in both AWS and Azure. We get you going with a fully operational data platform in only one day! More info on our website.